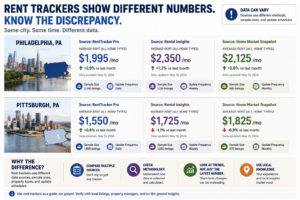
Rent data trackers frequently disagree with each other for the same city, sometimes by hundreds of dollars, because each pulls from a different sample of listings and methodology. As of mid-2026, Zumper puts Philadelphia’s average rent around $1,630, down roughly 6% year-over-year, while Pittsburgh sits near $1,500, essentially flat. Both cities show significant neighborhood-level variance that the citywide average obscures.
Pull up three different rent trackers for the same Philadelphia zip code and you’ll frequently get three different numbers, sometimes varying by several hundred dollars a month. That’s not one of them being wrong exactly. It’s that “average rent” means something different depending on which listings a platform samples, how it weighs unit type and size, and whether it’s tracking asking rent or actual signed leases.
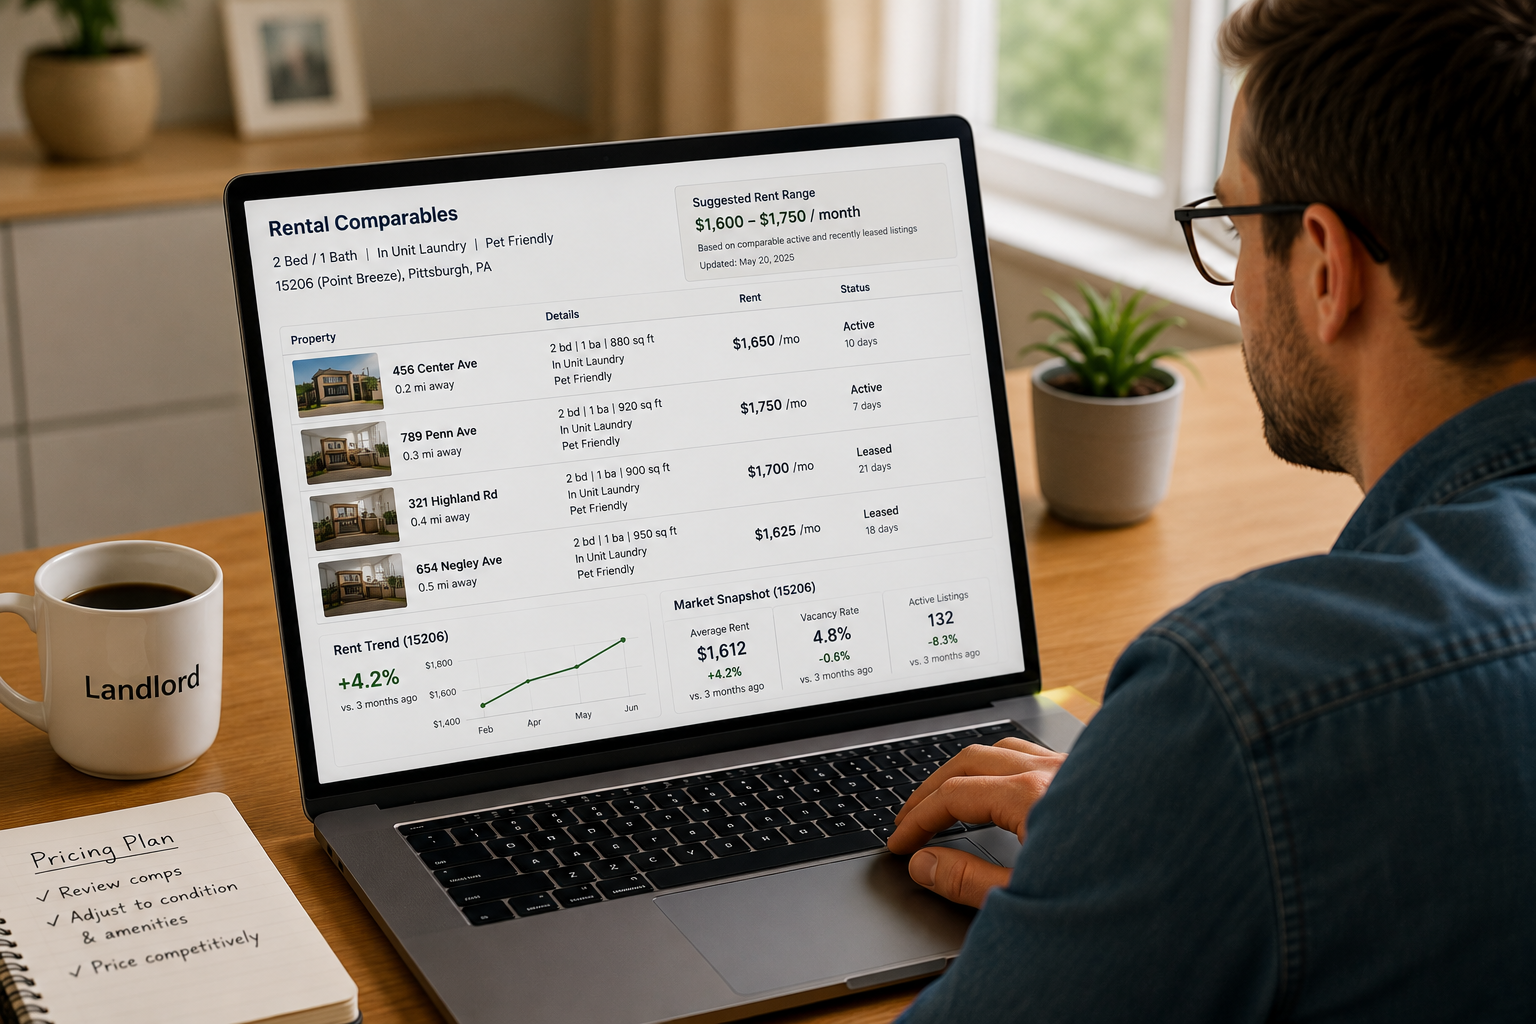
For a landlord trying to price a listing correctly, that inconsistency matters. Anchoring to the wrong data source, or to a citywide average when your property sits in a neighborhood that runs well above or below it, is one of the most common and avoidable pricing mistakes owners make.
Why the Numbers Don’t Match Across Sources
Different platforms pull from different listing pools. Some track only active listings on their own platform, which skews toward whatever inventory happens to be advertised there. Others blend multiple data sources or weight toward larger apartment communities over smaller individual rentals, which can push averages in either direction depending on what’s most represented in a given city’s rental stock.
According to data, the average Philadelphia rent sat around $1,630, down 6% from the prior year. Other trackers covering the same market and timeframe showed figures closer to $2,000 or higher for citywide averages, a gap large enough to meaningfully change a pricing decision depending on which source an owner happens to check first. Neither number is necessarily wrong. They’re measuring overlapping but different slices of the same market.
What’s Actually Consistent Across Sources
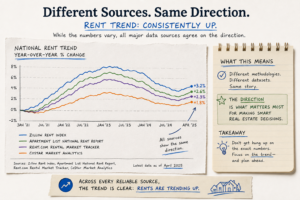
While exact dollar figures vary, the directional trend tends to agree more than the absolute numbers do. Multiple sources point to Philadelphia rents softening or holding roughly flat through much of 2026, consistent with the broader national vacancy and time-to-lease trends covered elsewhere in this market truth pillar. Pittsburgh shows a similar pattern, data puts the citywide average near $1,500, essentially unchanged year-over-year, a flat trend rather than a sharp move in either direction.
That directional agreement, even without dollar-figure agreement, is actually the more useful signal for most landlords. Knowing whether your market is heating up, cooling down, or holding steady matters more for a pricing decision than knowing the exact citywide average to the dollar, since neighborhood-level pricing should be based on direct comparables anyway.
The exact citywide average almost never matches what your specific property should rent for. The trend direction is the useful part. The dollar figure is a starting point, not an answer.
Neighborhood Variance Dwarfs Citywide Averages
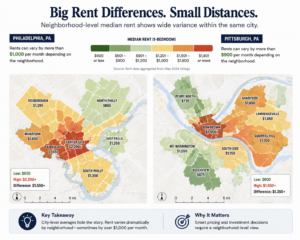
This is where citywide averages become genuinely misleading if used alone. According to data, rents in the most affordable Philadelphia neighborhoods run well below $1,200, while premium neighborhoods clear $3,000 or more, a spread wide enough that the citywide average describes almost no individual property accurately.
The same holds true in Pittsburgh, where some specific neighborhoods have shown year-over-year swings exceeding 40% or even 100% in either direction, while the citywide figure stayed comparatively flat. A property in a neighborhood experiencing rapid appreciation, or rapid softening, will be priced badly if the owner anchors to the citywide number instead of direct local comparables.
How to Read Rent Data Without Getting Misled
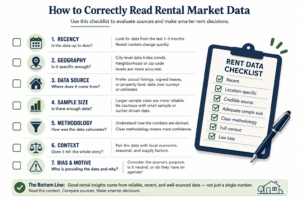
| What to Do | Why It Matters |
|---|---|
| Compare multiple sources for direction, not exact figures | Absolute numbers vary by methodology, trend direction is more consistent |
| Pull neighborhood-level data, not just citywide averages | Citywide figures can obscure wide local variance |
| Weight recent data more heavily than older reports | Softening or tightening trends can shift within a few months |
| Cross-check against actual comparable listings, not aggregated averages | The most accurate pricing signal is what’s actually leasing nearby right now |
| Note whether data reflects asking rent or signed leases | Asking rent can run higher than what units actually lease for in a softer market |
When Citywide Data Is Useful vs. When It Isn’t
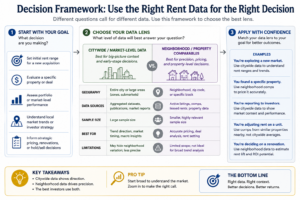
Citywide averages are useful for:
- Understanding broad market direction, softening, tightening, or flat
- Comparing Philadelphia and Pittsburgh against each other or against national trends
- Long-term portfolio-level planning across multiple neighborhoods
Citywide averages are not useful for:
- Pricing an individual listing, where neighborhood comparables matter far more
- Making a specific buy or sell decision on one property
- Comparing your property’s performance against “the market” without controlling for location
Getting Started: Building a Reliable Pricing Process
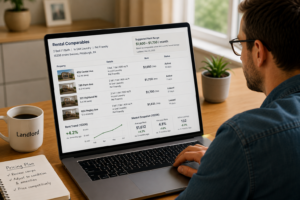
Pull three to five direct comparables in your specific neighborhood before setting a price. This beats any citywide average for accuracy, regardless of which data source you’re using.
Check more than one data source for trend direction. If multiple trackers agree the market is softening, that’s a more reliable signal than any single platform’s exact number.
Re-check comparables every time you have a new vacancy. Rent data shifts, and pricing based on comparables from six months ago can already be stale.
Distinguish asking rent from what’s actually leasing. A listing sitting at a high asking price for weeks isn’t a reliable comparable if it hasn’t actually found a tenant at that number.
Ready to Price Your Property Accurately?
If you want pricing based on real, current local comparables rather than a citywide average that may not reflect your specific neighborhood, that’s exactly the kind of market knowledge professional management is built to apply.
Frequently Asked Questions
Why do different websites show different average rent prices for the same city?
Rent tracking platforms pull from different listing samples and use different methodologies, some track only their own platform’s listings, others blend multiple sources or weight differently by unit type. This produces different absolute numbers even when the underlying market conditions are the same.
What is the average rent in Philadelphia in 2026?
Estimates vary by source, with some trackers showing figures around $1,630 and others showing figures closer to $2,000 or higher for the same period, reflecting differences in sampling and methodology rather than disagreement about market direction.
What is the average rent in Pittsburgh in 2026?
Most trackers show Pittsburgh’s citywide average rent in the $1,500 range as of mid-2026, with year-over-year change relatively flat compared to the more noticeable softening trend observed in some other markets.
Should I use citywide rent averages to price my rental property?
No, not on their own. Citywide averages are useful for understanding broad market direction, but individual property pricing should be based on direct comparables in the specific neighborhood, since neighborhood-level variance can be far wider than the citywide figure suggests.
How often does rent data change in a given market?
Rent data can shift meaningfully within a few months, especially in a market experiencing softening or tightening trends. Comparables used for pricing should be refreshed at every new vacancy rather than reused from previous listings.
Are Philadelphia and Pittsburgh rent trends currently rising or falling?
As of mid-2026, most data sources point to Philadelphia rents softening or holding roughly flat, while Pittsburgh has shown an essentially flat year-over-year trend citywide, though both cities have specific neighborhoods moving well outside those broader averages.
How Rentwell Helps Owners Make This Shift
This is the exact shift Rentwell builds for owners across Philadelphia and Pittsburgh: leasing systems that fill vacancies on a predictable schedule, a maintenance program that catches issues before they get expensive, and owner reporting that answers the question before it gets asked. Owners get their hours back, and they get them back with a clearer picture of how each property is actually performing.
If self-managing is starting to feel like a second job instead of an investment, a second set of eyes on the setup costs nothing.
Rentwell is a full-service property management company serving Philadelphia, Pittsburgh, West Chester, and the surrounding Pennsylvania communities. With offices in Clifton Heights, Pittsburgh, and West Chester, Rentwell helps real estate investors protect their assets, reduce operational stress, and build long-term wealth through professional property management.