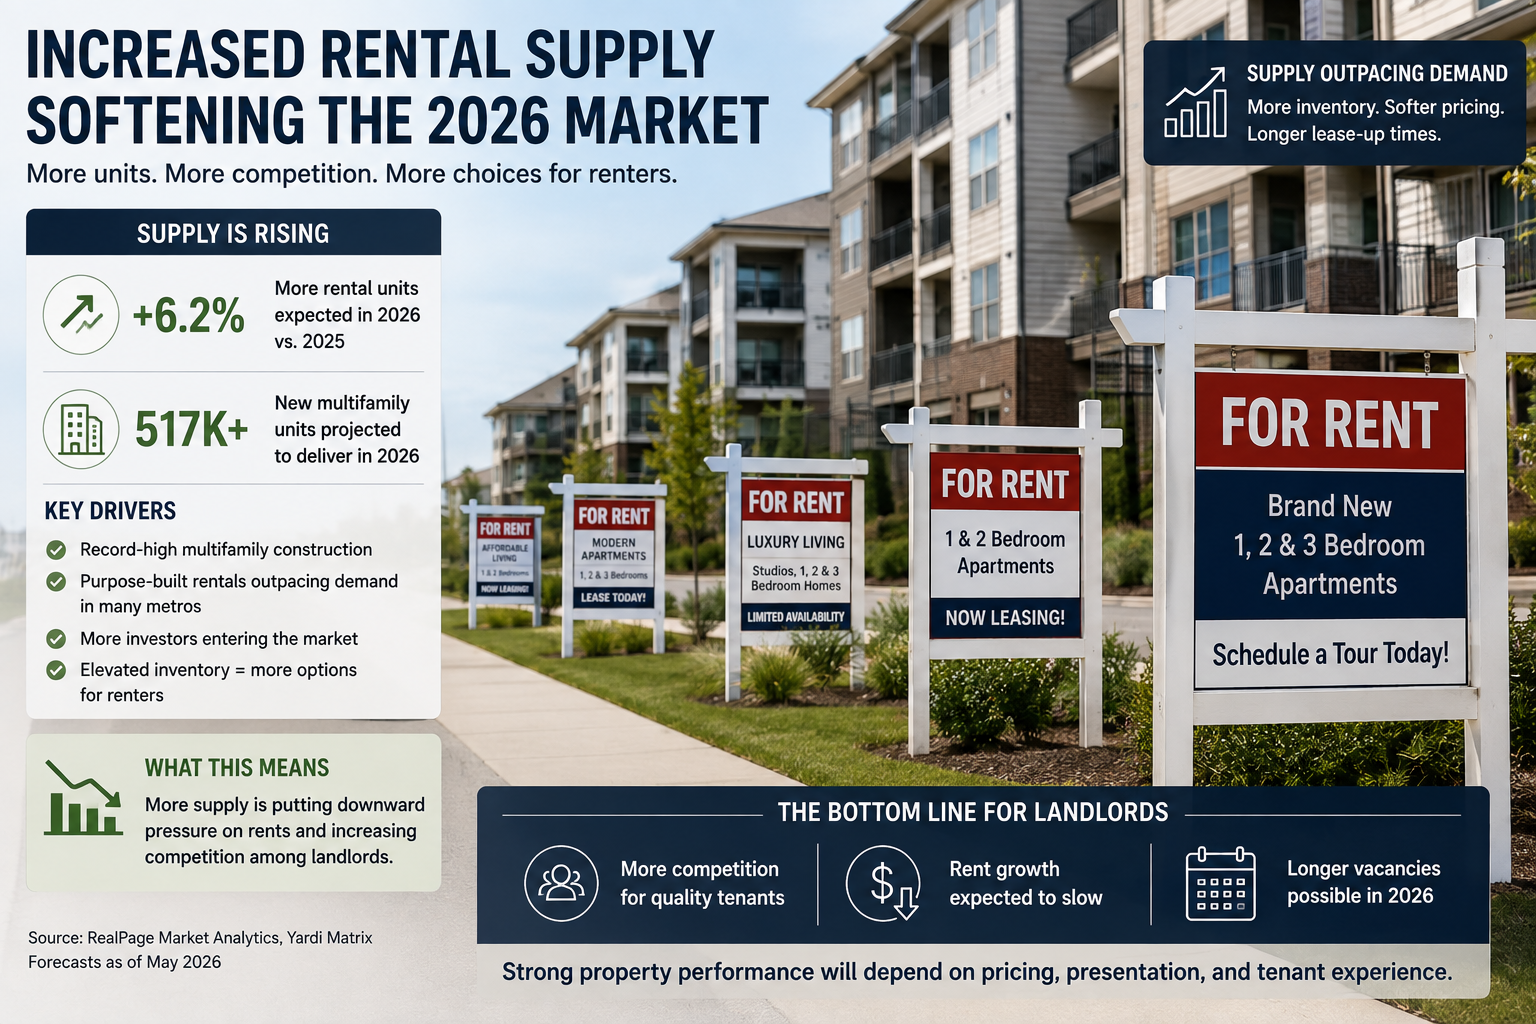
National vacancy sat at 7.3% in early 2026, with median time from listing to signed lease reaching 41 days, the highest reading since 2019. A realistically well-run rental in a typical market should expect somewhere in the 30 to 45 day range depending on pricing accuracy, presentation, and local demand, with older or overpriced listings running considerably longer.
If your rental has been sitting for three weeks and you’re starting to panic, the first thing worth knowing is that 2026 isn’t 2021. The tight, multiple-applicants-in-a-day rental market of a few years ago has genuinely shifted, and comparing your current vacancy against memories of that market, or against a friend’s story from that era, sets an expectation the current market simply can’t match.
That doesn’t mean every extended vacancy is normal. It means the baseline itself has moved, and knowing where that baseline actually sits lets you tell the difference between a listing that’s on a normal 2026 timeline and one that’s genuinely stuck.
The Current National Baseline
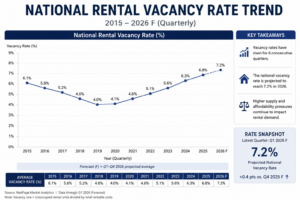
According to data, the national vacancy rate hit 7.3% in early 2026, a new high, while median list-to-lease time stretched to 41 days. That 41-day figure is worth sitting with, because it’s the highest reading Apartment List has recorded going back to 2019, meaning even a well-run listing today is working against a genuinely softer market than most owners are mentally calibrated for.
January and February 2026 both ran at or above 40 days, two consecutive months confirming a real trend rather than seasonal noise. Operators who built their 2026 leasing budgets around 2024 fill-time assumptions are working with a gap they likely haven’t priced into their expectations yet.
Why the Market Softened
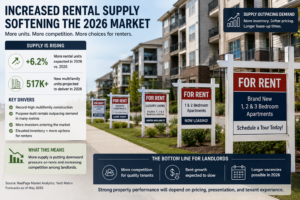
The softening traces largely to supply. A construction boom that peaked in 2024 added a historic volume of new multifamily units to the market, and that inventory is still working its way through absorption. At the same time, according to data, lead volume per listing hit the lowest first-quarter reading on record for the platform, meaning renters simply have more options to compare before committing to any single unit.
That combination, more supply, fewer leads per listing, is exactly what produces a longer time-to-lease even when nothing about an individual property or owner’s process has changed. It’s a market-wide shift, not a signal that your specific listing is doing something wrong.
A vacancy that would have felt alarming in 2021 might be completely normal in 2026. The market moved. Your expectations need to move with it.
What a Realistic Timeline Looks Like by Situation
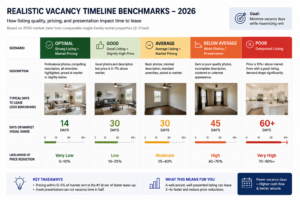
A well-priced, well-presented listing in a typical Philadelphia or Pittsburgh market should reasonably expect something close to the national 30 to 41 day range. Listings priced above comparable local rentals, or with weak photos and slow response times, should expect to run longer, sometimes considerably. Conversely, data also shows that properties with strong conversion efficiency, meaning showings-per-lead and application rates that hold up well, can still lease faster than the market average even in a softer overall environment, because conversion quality partially offsets lower lead volume.
The honest takeaway is that both things are true at once: the market is genuinely slower in 2026, and process quality still matters more than most owners think. A listing that’s both priced right and presented well isn’t guaranteed to lease in two weeks, but it’s positioned to outperform the market average rather than match the slowest end of it.
Realistic vs. Unrealistic Vacancy Expectations in 2026
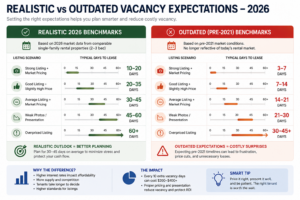
| Expectation | 2021-Era Benchmark | Realistic 2026 Benchmark |
|---|---|---|
| Days to lease | Often under 2 weeks | 30-41 days typical, longer if overpriced |
| Leads per listing | Up to 30 | Under 22 |
| Applications per showing | High, multiple same-day offers common | Lower, more careful renter comparison |
| Vacancy rate context | Around 5% or lower nationally | 7.2-7.3% nationally |
| Pricing flexibility | Sellers’ market, minimal negotiation | Tighter margins, comparable-based pricing matters more |
When Your Timeline Is Normal vs. When Something Needs Fixing
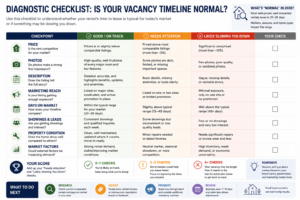
Your vacancy is likely within normal range when:
- You’re under 45 days and inquiries have been steady throughout
- Your pricing is confirmed against actual comparable listings, not assumptions
- Showings are converting to applications at a reasonable rate, even if slowly
Something likely needs fixing when:
- You’re well past 45 days with no clear improvement in activity
- Comparable units nearby are leasing meaningfully faster
- Inquiry volume has been consistently low from day one, suggesting a pricing or presentation issue rather than market softness alone
Getting Started: Calibrating Your Own Expectations
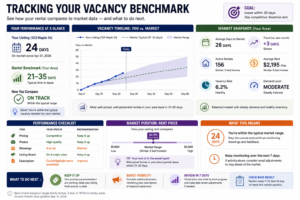
Anchor your expectations to 2026 data, not memory of a tighter market. The 30 to 41 day national range is the realistic starting point, not a warning sign on its own.
Compare against current local comparables, not last year’s listing. Philadelphia and Pittsburgh submarkets can run meaningfully different from the national average in either direction.
Track your own conversion rates, not just total days vacant. Knowing whether you’re weak on leads, showings, or applications tells you what to actually fix.
Revisit pricing at the two-week mark if activity is weak. Waiting until day 40 to address a pricing problem that was visible at day 14 costs real money.
Ready to Benchmark Your Vacancy Against Real Market Data?
If you’re not sure whether your current vacancy is tracking normally for 2026 or actually needs attention, a look at real local comparables is the fastest way to know.
Frequently Asked Questions
What is the average time to lease a rental property in 2026?
National data from early 2026 shows a median time from listing to signed lease of 41 days, the highest reading recorded since 2019. This varies by market, with well-priced, well-presented listings often performing better than the national average.
What is the current national rental vacancy rate?
The national vacancy rate reached 7.3% in early 2026, among the highest readings in recent years, driven largely by a historic volume of new multifamily construction still being absorbed by the market.
Why is my rental taking longer to lease than it used to?
Broader market conditions have shifted. Increased rental supply from a 2024 construction peak, combined with fewer leads per listing, has pushed time-to-lease higher across the board, independent of anything specific to your property or process.
How do I know if my vacancy is normal or a sign of a real problem?
Being under 45 days with steady inquiry activity and confirmed market-rate pricing is generally within normal 2026 range. Being well past 45 days, or seeing meaningfully slower activity than comparable local listings, suggests a pricing or presentation issue worth addressing.
Does a slower rental market mean I should lower my price significantly?
Not necessarily. Pricing should be based on actual comparable listings in your specific submarket, not a general sense that the market has softened. Overcorrecting on price when the real issue is presentation or response speed can cost more than it fixes.
Are Philadelphia and Pittsburgh vacancy trends the same as the national average?
Not exactly. Local submarkets can run meaningfully different from national figures, which is why comparing your listing against current local comparables, rather than national averages alone, gives a more accurate benchmark.
How Rentwell Helps Owners Make This Shift
This is the exact shift Rentwell builds for owners across Philadelphia and Pittsburgh: leasing systems that fill vacancies on a predictable schedule, a maintenance program that catches issues before they get expensive, and owner reporting that answers the question before it gets asked. Owners get their hours back, and they get them back with a clearer picture of how each property is actually performing.
If self-managing is starting to feel like a second job instead of an investment, a second set of eyes on the setup costs nothing.
Rentwell is a full-service property management company serving Philadelphia, Pittsburgh, West Chester, and the surrounding Pennsylvania communities. With offices in Clifton Heights, Pittsburgh, and West Chester, Rentwell helps real estate investors protect their assets, reduce operational stress, and build long-term wealth through professional property management.